Coordinate system
Categories: graphics html canvas
When you draw shapes on the HTML canvas, they are positioned using (x, y) coordinates, just like points on a graph.
However, unlike graph paper, the y values count down from the top of the canvas. So this code:
context.fillStyle = 'blue';
context.fillRect(100, 50, 200, 75);
creates something like this (assuming the canvas is 400 pixels wide and 200 pixels high):
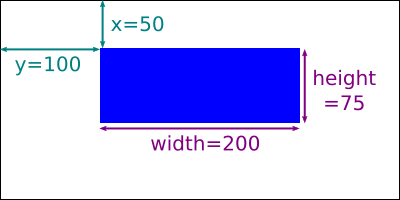
The parameters are fillRect(x, y, width, height), which means that the top left of the rectangle is positioned 100 pixels from the left edge of the canvas, and 50 pixels down from the top. All measurements are in pixels.
This can be confusing at first, especially if you are drawing graphs or charts where you expect y to count up from the bottom of the canvas. Be prepared to get things upside down once in a while when you first start learning.
See also
Sign up to the Creative Coding Newletter
Join my newsletter to receive occasional emails when new content is added, using the form below:
Popular tags
555 timer abstract data type abstraction addition algorithm and gate array ascii ascii85 base32 base64 battery binary binary encoding binary search bit block cipher block padding byte canvas colour coming soon computer music condition cryptographic attacks cryptography decomposition decryption deduplication dictionary attack encryption file server flash memory hard drive hashing hexadecimal hmac html image insertion sort ip address key derivation lamp linear search list mac mac address mesh network message authentication code music nand gate network storage none nor gate not gate op-amp or gate pixel private key python quantisation queue raid ram relational operator resources rgb rom search sort sound synthesis ssd star network supercollider svg switch symmetric encryption truth table turtle graphics yenc